Results & Discussion
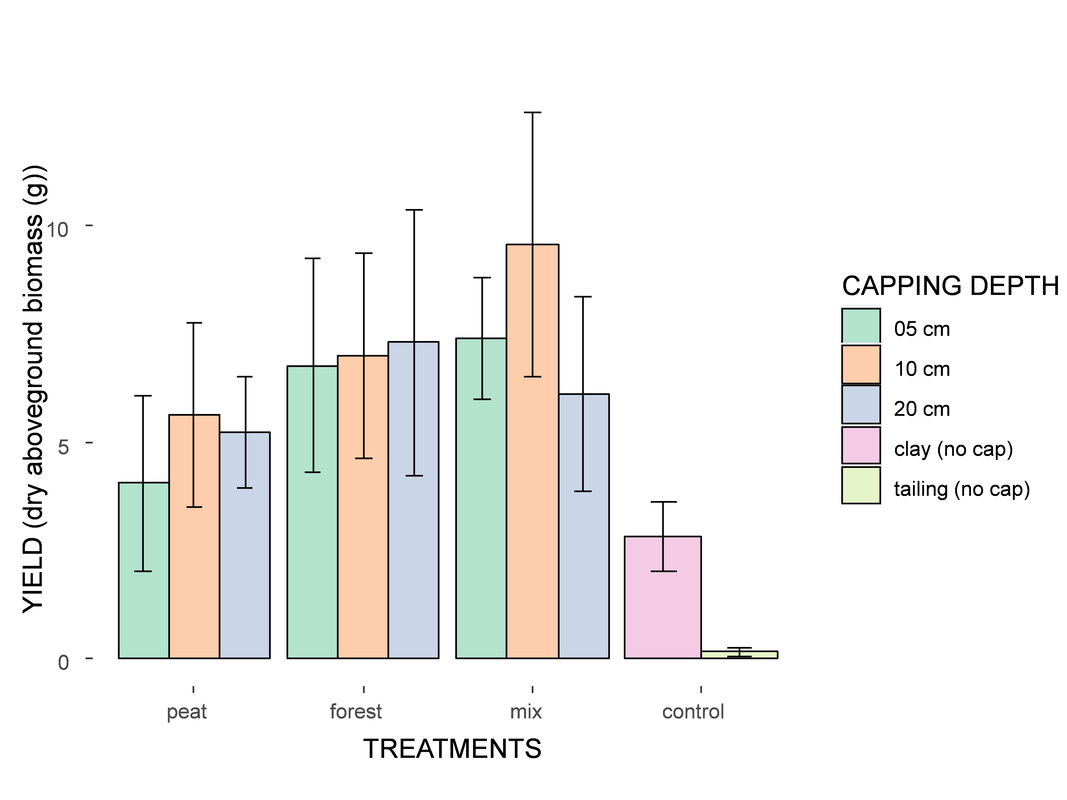
Figure 12. Bar graph of biomass results sorted by different capping depths and treatments.
The graph in Figure 12 is a bar graph examining the dry above-ground biomass (in g) of the willow, as a response to the manipulated predictor variables, soil capping depth and soil type (treatments). ANOVA showed no interactions between capping depth and treatment (see Figure 15-a), but significant differences within capping depths. When analysed separately by treatment and by capping depth, significant differences were found within each variable (see Figure 15-b, and 15-c).
The graph in Figure 13-a is another bar graph examining the dry aboveground biomass (in g) of the willow, as a response to the manipulated treatment/soil type variables. The average biomass for the controls (saline and clay) is 4.32g and 5.0g respectively. The average biomass for the forest floor capping soil is 7.0 g, for the peat capping soil it is 5.62g, for the 50/50 mixture it is 9.57g, and for the biochar treatment it is 8.12g. These results suggest that the soil type that best supports willow growth on tailings subsoil is the 50/50 mixture of forest floor mineral mix and peat mineral mix. The soil type with the lowest yielding results is the peat mineral mix, and the forest floor was in the middle. The controls (clay and saline clay) yielded the poorest results, which is an unexpected finding. Possible reasoning for such a finding could be the physical properties of the clay itself may have been too different from the tailings material, and may have provided worse growing conditions for the willow. Further analysis is required to determine the mechanisms of these results.
The graph in Figure 13-b is a bar graph examining the dry above-ground biomass (in g) of the willow, as a response to the manipulated predictor variable, the soil capping depth. The average biomass for the controls (0 cm capping depth) is 1.4 g, for the 5 cm capping depth the average biomass is 6.06 g, for the 10 cm capping depth the average biomass is 7.39 g, and for the 20 cm capping depth the average biomass is 6.21 g. This results show a large different in total aboveground biomass when a capping depth of any kind is added above the tailings subsoil. However, the differences among the capping depths (5, 10 and 20 cm) don’t show significantly different results. A possible explanation as to why adding any capping depth greatly improves growth conditions, could be that the soil layer allows the seedlings to better establish themselves, before further developing their roots into the tailings layer. Proper seedling establishment may be more important to root development in tailings than the relative depth of the capping soil.
When looking at the results of the biochar amendment, the average aboveground biomass was relatively high, however did not yield greater biomass than the 50/50 mixture. Considering the biochar was added to a 50/50 mixture, the expected results were to be similar or greater yields. These results indicate that biochar had no significant effect on plant growth. The clay and saline-clay controls showed significantly lower yields, which indicates their physical properties may have been too different than the tailings, therefore didn't serve as a good control.
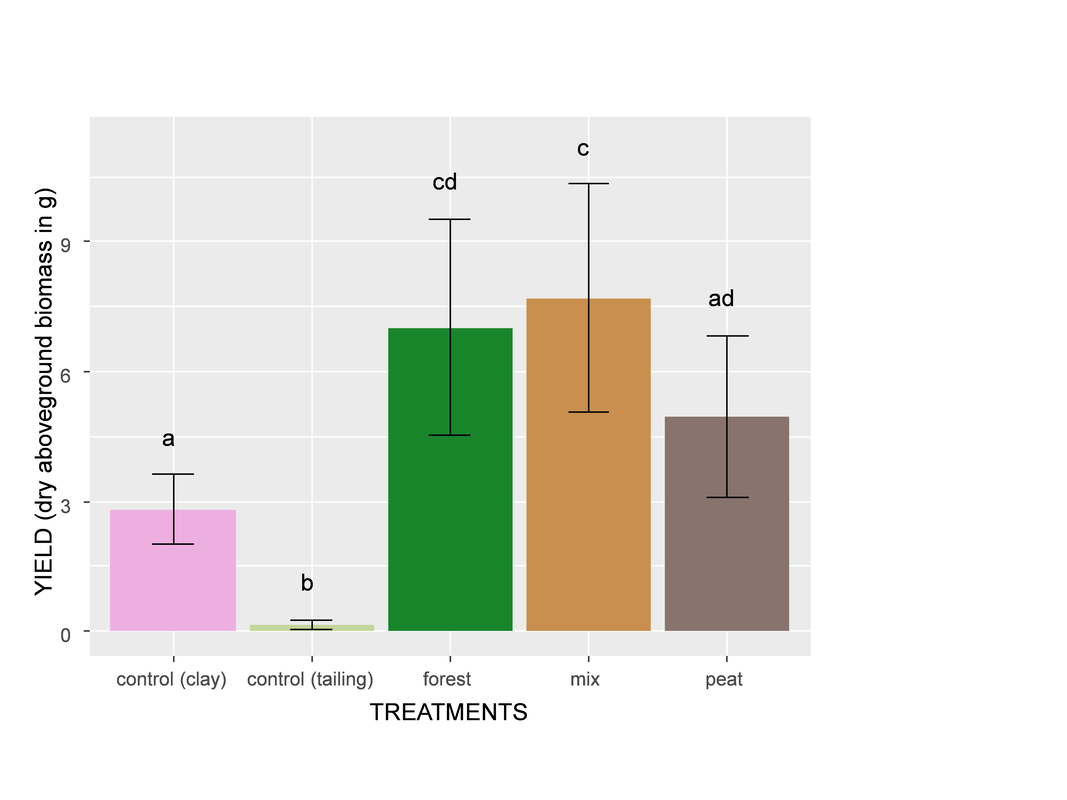
Figure 13-a. Bar graph showing growth results of biomass, sorted by soil type/treatments.
|
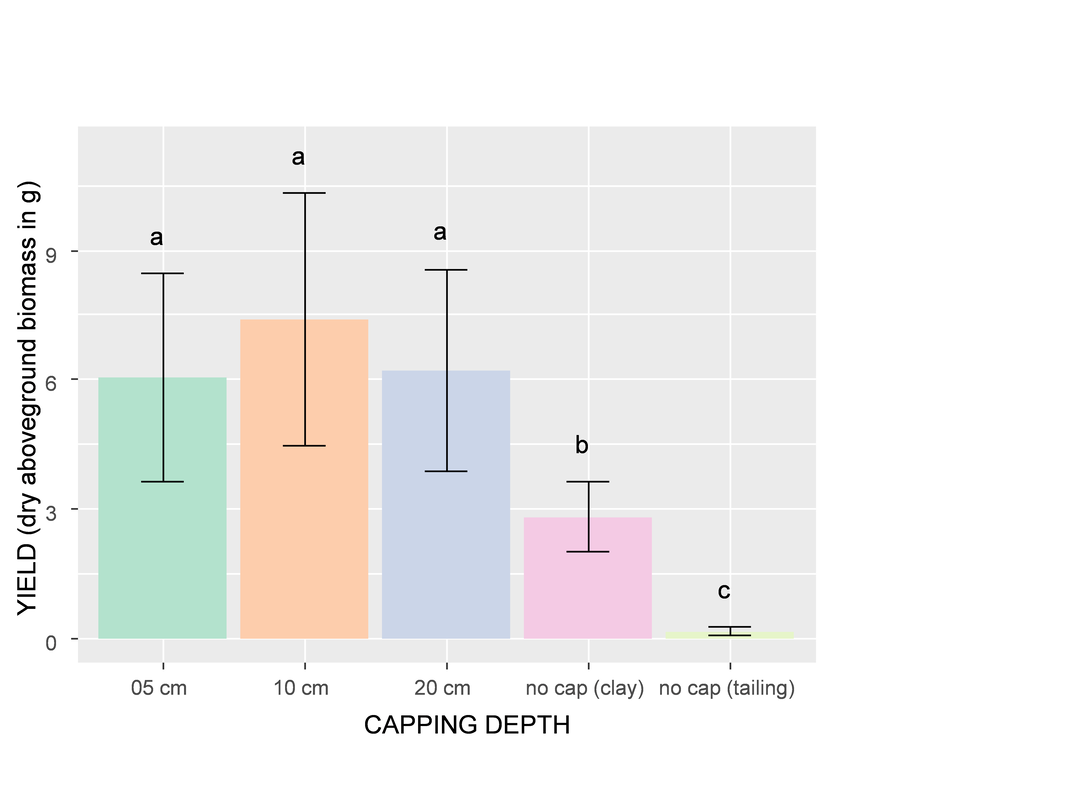
Figure 13-b. Bar graph showing growth results of biomass, sorted by capping depth.
|
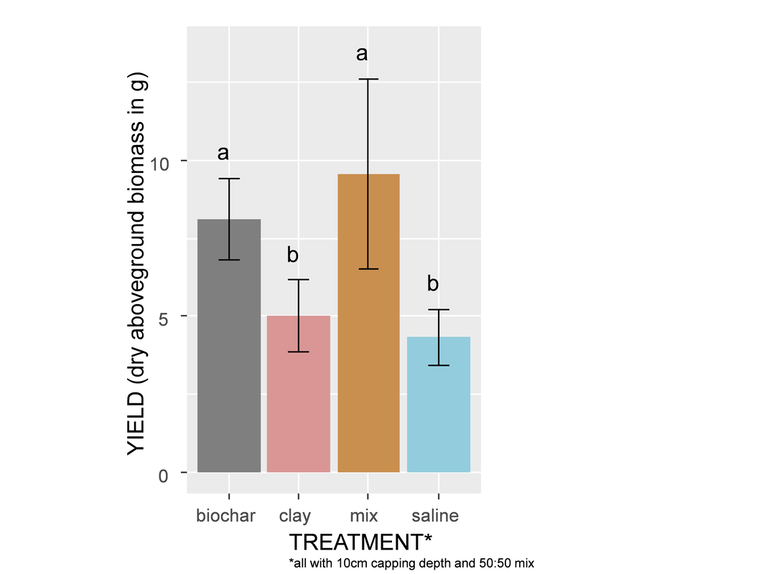
Figure 14. Bar graph showing growth results of biomass for sub-experiment 2.
ANOVA Tables
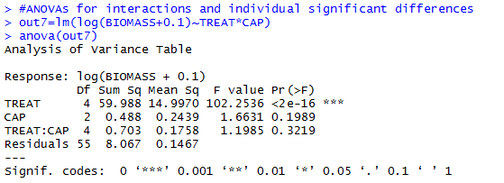
Figure 15-a. ANOVA analysis for all interactions.
|
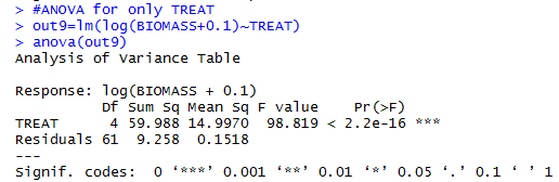
Figure 15-b. ANOVA analysis comparing treatments.
|
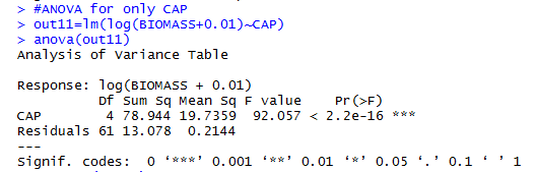
Figure 15-c. ANOVA analysis comparing capping depths.
|
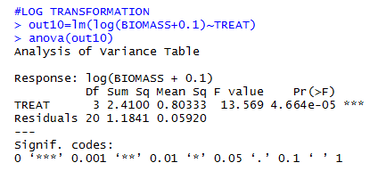
Figure 15-d. ANOVA analysis comparing 4 treatments at 10 cm capping depths.
|
